兴趣课-时钟的实现
一、关于Canvas
1. 什么是canvas
1 | <canvas>是一个可以使用脚本(通常为JavaScript)在其中绘制图形的 HTML 元素。 |
2. 基础结构
1 | <canvas id="mycanvas" width="200" height="300"> |
canvas 标签只有两个属性—— width和height,这两个属性是可选的。当我们没有定义时,Canvas 的默认大小为300像素×150像素(宽×高,像素的单位是px)。
可以像给其他DOM元素一样给canvas添加样式;当开始时没有为canvas规定样式规则,其将会完全透明。
canvas是一个二维网格,以左上角坐标为(0,0)
3. 绘制矩形
- 参数:
- x与y指定了在canvas画布上所绘制的矩形的左上角(相对于原点)的坐标。
- width和height设置矩形的尺寸。
- 绘制一个填充的矩形
1 | fillRect( x ,y ,width, height) |
- 绘制一个矩形的边框
1 | strokeRect( x ,y ,width, height) |
4. 绘制路径
图形的基本元素是路径。路径是通过不同颜色和宽度的线段或曲线相连形成的不同形状的点的集合。一个路径,甚至一个子路径,都是闭合的。使用路径绘制图形需要一些额外的步骤。
- 需要创建路径起始点。
- 使用画图命令去画出路径。
- 把路径封闭。
- 一旦路径生成,就能通过描边或填充路径区域来渲染图形。
以下是所要用到的函数:
- 新建一条路径,生成之后,图形绘制命令被指向到路径上生成路径。
1 | beginPath() |
- 闭合路径之后图形绘制命令又重新指向到上下文中。
1 | closePath() |
这个方法会通过绘制一条从当前点到开始点的直线来闭合图形。如果图形是已经闭合了的,即当前点为开始点,该函数什么也不做。
- 通过线条来绘制图形轮廓。
1 | stroke() |
- 通过填充路径的内容区域生成实心的图形。
1 | fill() |
- 绘制线段
1 | moveTo(x,y)//移动笔触 |
1 | lineTo(x,y)//将笔触移动到指定的坐标x以及y上 |
例子:
1 | cxt.beginPath(); |
5. 弧线
绘制圆弧或者圆,我们使用arc()方法

1 | arc(x, y, radius, startAngle, endAngle, anticlockwise) |
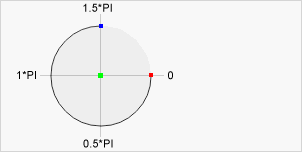
画一个以(x,y)为圆心的以radius为半径的圆弧(圆),从startAngle开始到endAngle结束,参数anticlockwise 为一个布尔值。为true时,是逆时针方向,否则顺时针方向。
注意:arc()函数中的角度单位是弧度,不是度数。角度与弧度的js表达式:radians=(Math.PI/180)*degrees。
例子:
1 | cxt.beginPath(); |
6. 色彩样式
canvas提供了两个色彩属性
- 设置图形的填充颜色。
1 | fillStyle = color |
- 设置图形轮廓的颜色。
1 | strokeStyle = color |
注意: 一旦您设置了 strokeStyle 或者 fillStyle 的值,那么这个新值就会成为新绘制的图形的默认值。如果你要给每个图形上不同的颜色,你需要重新设置 fillStyle 或 strokeStyle 的值。
7. 线型的样式
- 设置线条宽度:lineWidth = value
8. 渐变Gradients
我们还可以用线性或者径向的渐变来填充或描边
- 线性渐变
createLinearGradient(x1, y1, x2, y2) createLinearGradient 方法接受 4 个参数,表示渐变的起点 (x1,y1) 与终点 (x2,y2)。
- 例子:
1 | var linearGradient=cxt.createLinearGradient(50,50,250,250); |
9. 绘制文本
在指定的(x,y)位置填充指定的文本,绘制的最大宽度是可选的.
1 | fillText(text, x, y [, maxWidth]) |
1 | strokeText(text, x, y [, maxWidth]) |
二、关于JavaScript
1. setInterval
setInterval是 JavaScript 中的一个定时器函数,用于周期性地执行指定的代码。
基本语法结构
1 | setInterval(function, milliseconds); |
function: 要执行的函数或代码块milliseconds: 执行间隔时间(毫秒)
使用示例
1 | javascript复制代码// 每隔一秒输出一次当前时间 |
注意事项
setInterval返回一个唯一的标识符,可通过clearInterval来清除定时器。
2. Date 对象
- JavaScript 中用于处理日期和时间的内置对象。
- 可以获取当前日期时间,创建特定日期、时间对象。
获取当前日期时间
1 | const currentDate = new Date(); |
获取小时、分钟、秒、毫秒:getHours(), getMinutes(), getSeconds(),getMilliseconds()
三.源码如下
1 |
|


